netclaw stats
netclaw stats tells you where your tokens are going, how many sessions are running, and whether memory is healthy. It also covers channel activity, webhook deliveries, and reminders. --json for scripts, --tui for a live dashboard.
netclaw stats [options]netclaw stats skills [options]Requires a running daemon. If it’s not up, start it with netclaw daemon start (or run netclaw init which starts it for you).
Options
Section titled “Options”| Flag | Description | Default |
|---|---|---|
--days <N> | Show trailing N-day daily breakdown | None (omits daily table) |
--all | Show all-time daily breakdown | Off |
--tui | Visual TUI dashboard | Off |
--json | Alias for --format json | — |
--format <text|json> | Output format | text |
Output
Section titled “Output”netclaw stats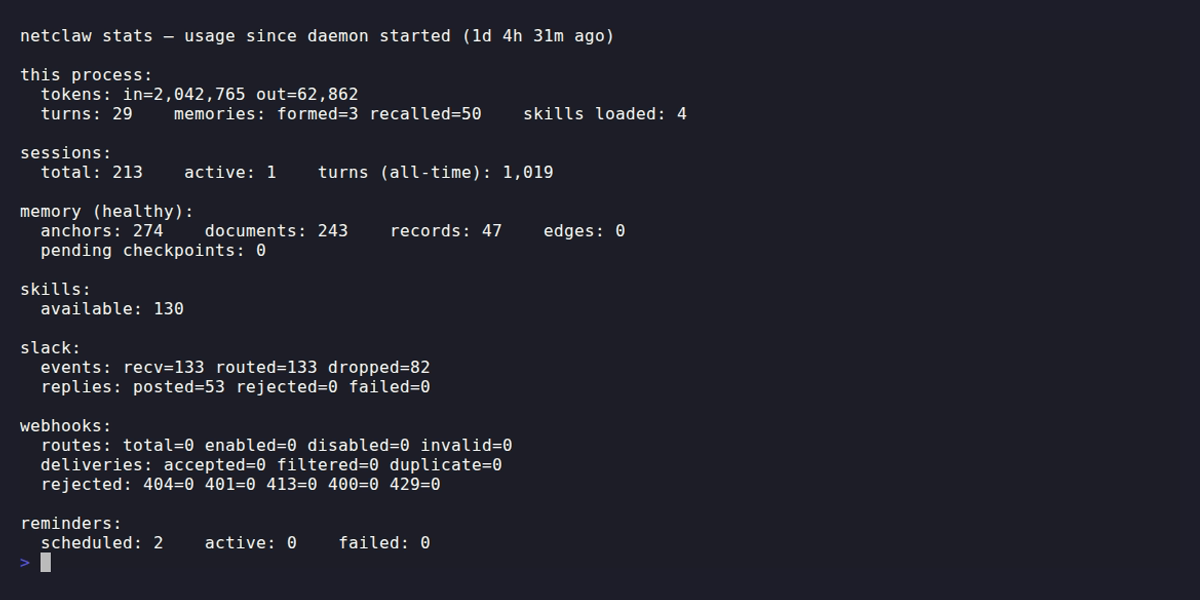
Without --days or --all, you get process-lifetime counters plus current snapshot data. No daily table.
| Section | What it shows |
|---|---|
| this process | Token consumption (in/out), turns completed, memories formed/recalled, skills loaded |
| sessions | Total, active, and all-time turn count |
| memory | Status (healthy, degraded, unavailable), anchor/document/record/edge counts, pending checkpoints |
| skills | Total available skill count |
| <channel> | Per-channel events (recv/routed/dropped) and replies (posted/rejected/failed) |
| webhooks | Route counts, delivery stats, rejection breakdown by HTTP status |
| reminders | Scheduled, active, and failed counts |
The “this process” counters live in the daemon process’s memory and reset when the daemon restarts. Everything else (sessions, memory, daily breakdown) is persisted to SQLite and survives restarts.
If memory status shows degraded or unavailable, run netclaw doctor --fix to fix common issues automatically.
Daily breakdown
Section titled “Daily breakdown”Add --days to see a per-day table of token usage and activity:
# Last 14 daysnetclaw stats --days 14
# All timenetclaw stats --all
Columns: date, input/output tokens, turns, sessions, memories formed/recalled, skills loaded. When more than one day of data is returned, a totals row appears at the bottom.
TUI dashboard
Section titled “TUI dashboard”netclaw stats --tuiOpens a full-screen dashboard. --tui always shows an ASCII bar chart of daily token usage, defaulting to the last 7 days. Pass --days N to change the window:
netclaw stats --tui --days 30The lower half of the dashboard shows the Daily Token Usage bar chart by default. Memory, per-channel, and Webhooks panels take its place when there’s no daily breakdown data.
Q, Escape, or Ctrl+C to quit.
Skill usage stats
Section titled “Skill usage stats”stats skills shows per-skill load counts broken down by day and invocation method (e.g., direct, auto, scheduled):
# Last 7 days (default)netclaw stats skills
# Last 30 daysnetclaw stats skills --days 30
# All timenetclaw stats skills --all
Each day shows total loads, a method breakdown, and per-skill counts (top 15). --tui doesn’t work with stats skills.
JSON output
Section titled “JSON output”netclaw stats --json# Total input tokens since daemon startednetclaw stats --json | jq '.tokens.inputTokensTotal'
# Daily token usage for the last 7 daysnetclaw stats --days 7 --json | jq '.dailyBreakdown[] | {date, inputTokens, outputTokens}'
# Active session countnetclaw stats --json | jq '.sessions.activeSessions'
# Memory health statusnetclaw stats --json | jq -r '.memory.status'stats skills --json returns a separate shape with daily skill load breakdowns:
netclaw stats skills --json | jq '.daily[] | {date, totalLoads}'Exit codes
Section titled “Exit codes”| Code | Meaning |
|---|---|
0 | Success |
1 | Daemon unreachable or error response |
Daemon endpoint
Section titled “Daemon endpoint”stats queries http://127.0.0.1:5199 by default. Override with:
NETCLAW_DAEMON_ENDPOINTenvironment variable~/.netclaw/client/config.json
See netclaw status for more on endpoint configuration.
When the daemon isn’t running
Section titled “When the daemon isn’t running”You’ll see one of two errors:
Connection refused — the daemon process isn’t running at all:
[FAIL] stats: unable to reach daemon at http://127.0.0.1:5199: Connection refused fix: run `netclaw daemon start` and retry.503 response — the daemon is up but not ready (still starting, or something broke):
[FAIL] stats: daemon returned 503 from http://127.0.0.1:5199 fix: run `netclaw daemon start` and retry.For 503s, netclaw doctor --fix can often sort out what’s wrong without a restart.
Related commands
Section titled “Related commands”netclaw status— live health check for daemon, connectors, and modelnetclaw doctor— config diagnostics with--fixfor auto-repairnetclaw sessions— if stats show unexpected session counts, dig into individual conversations herenetclaw init— first-run setup (starts the daemon for you)
Resources
Section titled “Resources”- jq manual — for wrangling
--jsonoutput - SQLite documentation — daily breakdown data is persisted here