netclaw status
netclaw status queries the running daemon and prints overall health, connector states, the active model, persistence, telemetry counters, and whether an update is available. Run it when something feels off, or wire it into a health check script.
netclaw status [options]Requires a running daemon. If it’s not up, start it with netclaw daemon start (or run netclaw init which starts it for you).
Options
Section titled “Options”| Flag | Description | Default |
|---|---|---|
--format <text|json> | Output format | text |
--json | Alias for --format json | — |
Output
Section titled “Output”netclaw status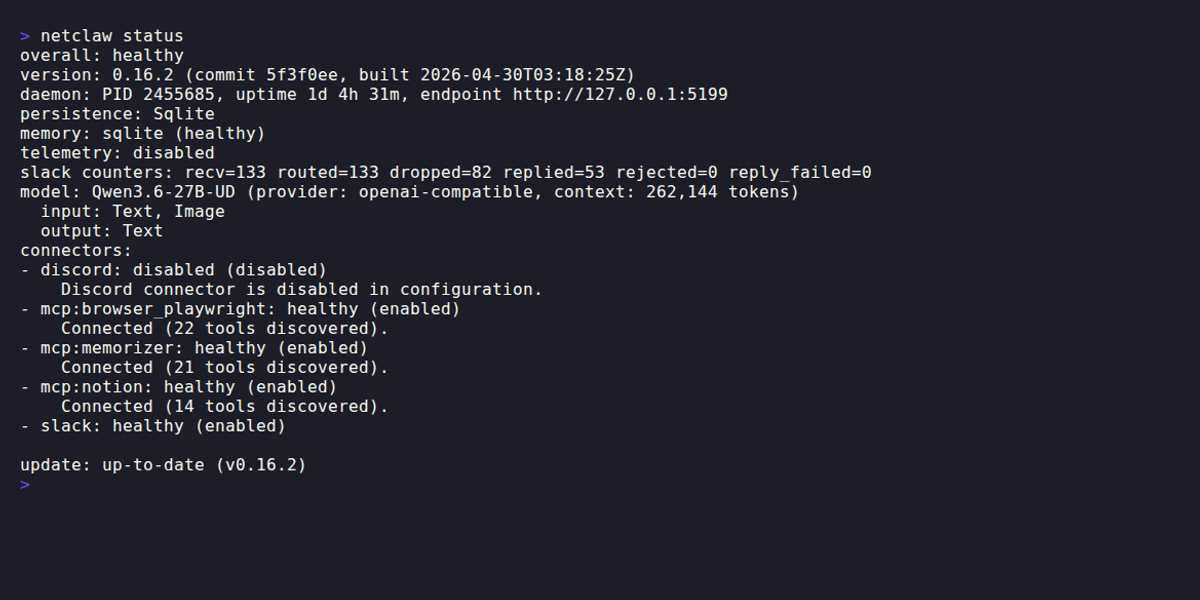
| Section | What it tells you |
|---|---|
| overall | healthy or degraded |
| version | Build version, commit hash, build timestamp |
| daemon | PID, uptime, endpoint URL |
| persistence | Storage provider (e.g., SQLite) |
| memory | Memory provider and status — returns unavailable, healthy, or degraded |
| telemetry | Enabled/disabled, OpenTelemetry Protocol (OTLP) endpoint if active |
| counters | Per-channel message stats: recv, routed, dropped, replied, rejected, reply_failed |
| model | Active model name, provider, context window, input/output modalities |
| connectors | Each connector’s key, status, and enabled/disabled state |
| update | Whether a newer version is available |
Overall status logic
Section titled “Overall status logic”overall reflects connector health:
- healthy — all enabled connectors are healthy
- degraded — any enabled connector is
disconnected,degraded,auth-required, orauth-failed
Connector statuses
Section titled “Connector statuses”Channel connectors (Slack, Discord) report: healthy, degraded, disconnected, disabled, unknown.
MCP connectors — keyed as mcp:<server-name> from your configured MCP tool servers — add: auth-required and auth-failed.
Disabled connectors still appear in the list with (disabled) so you can tell they’re intentionally off, not broken. To enable them, run netclaw config — channels, search, exposure mode, and webhooks all live there.
If any connector shows degraded or worse, run netclaw doctor --fix to auto-repair common issues. If that doesn’t resolve it, check the specific connector’s configuration in netclaw config.
Exit codes
Section titled “Exit codes”| Code | Meaning |
|---|---|
0 | Healthy |
2 | Degraded |
1 | Daemon unreachable or error response |
Exit code 2 for degraded (rather than 1) lets scripts distinguish “something’s wrong but running” from “down entirely”:
netclaw status > /dev/null 2>&1rc=$?case $rc in 0) echo "healthy" ;; 2) echo "degraded — check connectors" ;; *) echo "down or unreachable" ;;esacNote: the CLI overview documents exit code 2 as “usage/argument error” for most commands. status is an exception — it uses 2 specifically for degraded health.
JSON output
Section titled “JSON output”netclaw status --jsonReturns the full status response as JSON.
The JSON includes fields not shown in text output — notably reminders (with scheduledCount, activeExecutions, failedCount). Also, the version text section maps to the .build key in JSON, so use jq '.build' rather than jq '.version':
# Check overall healthnetclaw status --json | jq -r '.overall'
# Get version info (note: `.build`, not `.version`)netclaw status --json | jq '.build'
# List unhealthy connectorsnetclaw status --json | jq '[.connectors[] | select(.enabled and .status != "healthy")]'
When the daemon isn’t running
Section titled “When the daemon isn’t running”If the daemon is unreachable, you’ll see one of:
[FAIL] status: unable to reach daemon at http://127.0.0.1:5199: Connection refusedfix: run 'netclaw daemon start' and retry.[FAIL] status: daemon returned 503 from http://127.0.0.1:5199fix: run 'netclaw daemon status' and 'netclaw daemon start'.The distinction:
| Command | What it checks | Daemon required |
|---|---|---|
netclaw daemon status | PID file — is the process running? | No |
netclaw status | Live health query — are connectors, model, persistence all working? | Yes |
If you’re not sure the process is alive, start with daemon status. Once it’s up, status gives the full picture.
Daemon endpoint
Section titled “Daemon endpoint”status queries http://127.0.0.1:5199/api/health/status by default. Override with:
NETCLAW_DAEMON_ENDPOINT~/.netclaw/client/config.json
Related commands
Section titled “Related commands”netclaw config— Enable and configure connectors, search, exposure mode, and morenetclaw doctor— Diagnostics with auto-repair (--fix)netclaw stats— Token usage, session counts, and memory metricsnetclaw chat— Start a conversation (check status first if connections fail)netclaw init— First-run setup that starts the daemon for you
Resources
Section titled “Resources”- jq manual — for wrangling
--jsonoutput - OpenTelemetry collector docs — if you’re sending telemetry to an OTLP endpoint